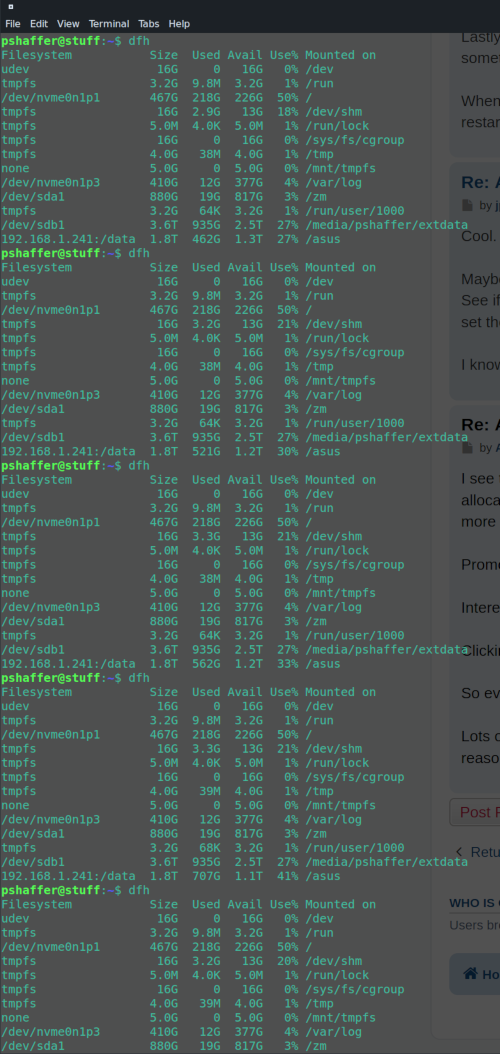
Another /dev/shm post - why the creep?
Posted: Tue Feb 09, 2021 4:41 pm
Hello everyone - hopefully this is a question that's been answered before in which doesn't show up in the search (as usual, I tried search first and tried to identify a posting that had a similar experience).
I have ZoneMinder 1.34.23-focal1 installed on my Ubuntu 20.04 machine. I'm running it on base hardware (no docker) and I have around 13 cameras monitoring with different setups (3 mocord, remainder modect). All of the cameras use RTSP and are configured appropriately.
My /dev/shm upon startup is around 42% full. I have verified that I have an 8GB /dev/shm that is being generated upon boot and I technically have room to expand if needed fairly easily.
My cameras are setup primarily to run 10 fps. My Image Buffer Size (frames) is set to 20, and my Pre-Event Image Count is set to 10 and Post Image Event is set to 300. I want the system to start saving a second before motion occurs and to minimally track for 30 seconds after the event has occurred. I believe this is the correct setup to accomplish that goal (and also may be part of the issue).
General operating - I don't see /dev/shm growing beyond 42% (or rarely so). Eventually though, for some reason, /dev/shm will take up 100% of the space and I'll usually see a single camera that is not longer being rendered in my Montage Review. Going to the server, stopping the zoneminder service, and then starting it again cleans out /dev/shm (0% space used) and then it starts back up at 42% usage. This seemed to start happening more in the last package update to .23 but I'm not sure if that is the root cause.
Is there a reason why a particular camera would cause /dev/shm to become full if the settings are all the same as what I described above? Is there some type of safety logic built into Zoneminder where /dev/shm can be automated to "cleanup" or "dump" data when it starts getting full? Are there conditions in which /dev/shm has files that are orphaned because the analysis services fail due to some camera/protocol centric issue?
How do I go about debugging the root cause of this issue? It seems to be happening every day and a quick restart of the service tackles it - but I'm not fond of setting up a restart every night to be quite honest...thoughts?
